title: Chrome DevTools WebMCP panel description: Inspect, test, and debug your tools with Chrome's built-in WebMCP panel.
Chrome DevTools has a dedicated WebMCP panel that shows every tool your page exposes to AI agents. It's the fastest way to verify your tools work before an agent ever sees them.
Open the panel
- Enable WebMCP:
chrome://flags/#enable-webmcp-testing(Chrome 146+) - Open your app and open DevTools (F12)
- Click the Application tab
- In the sidebar, click WebMCP
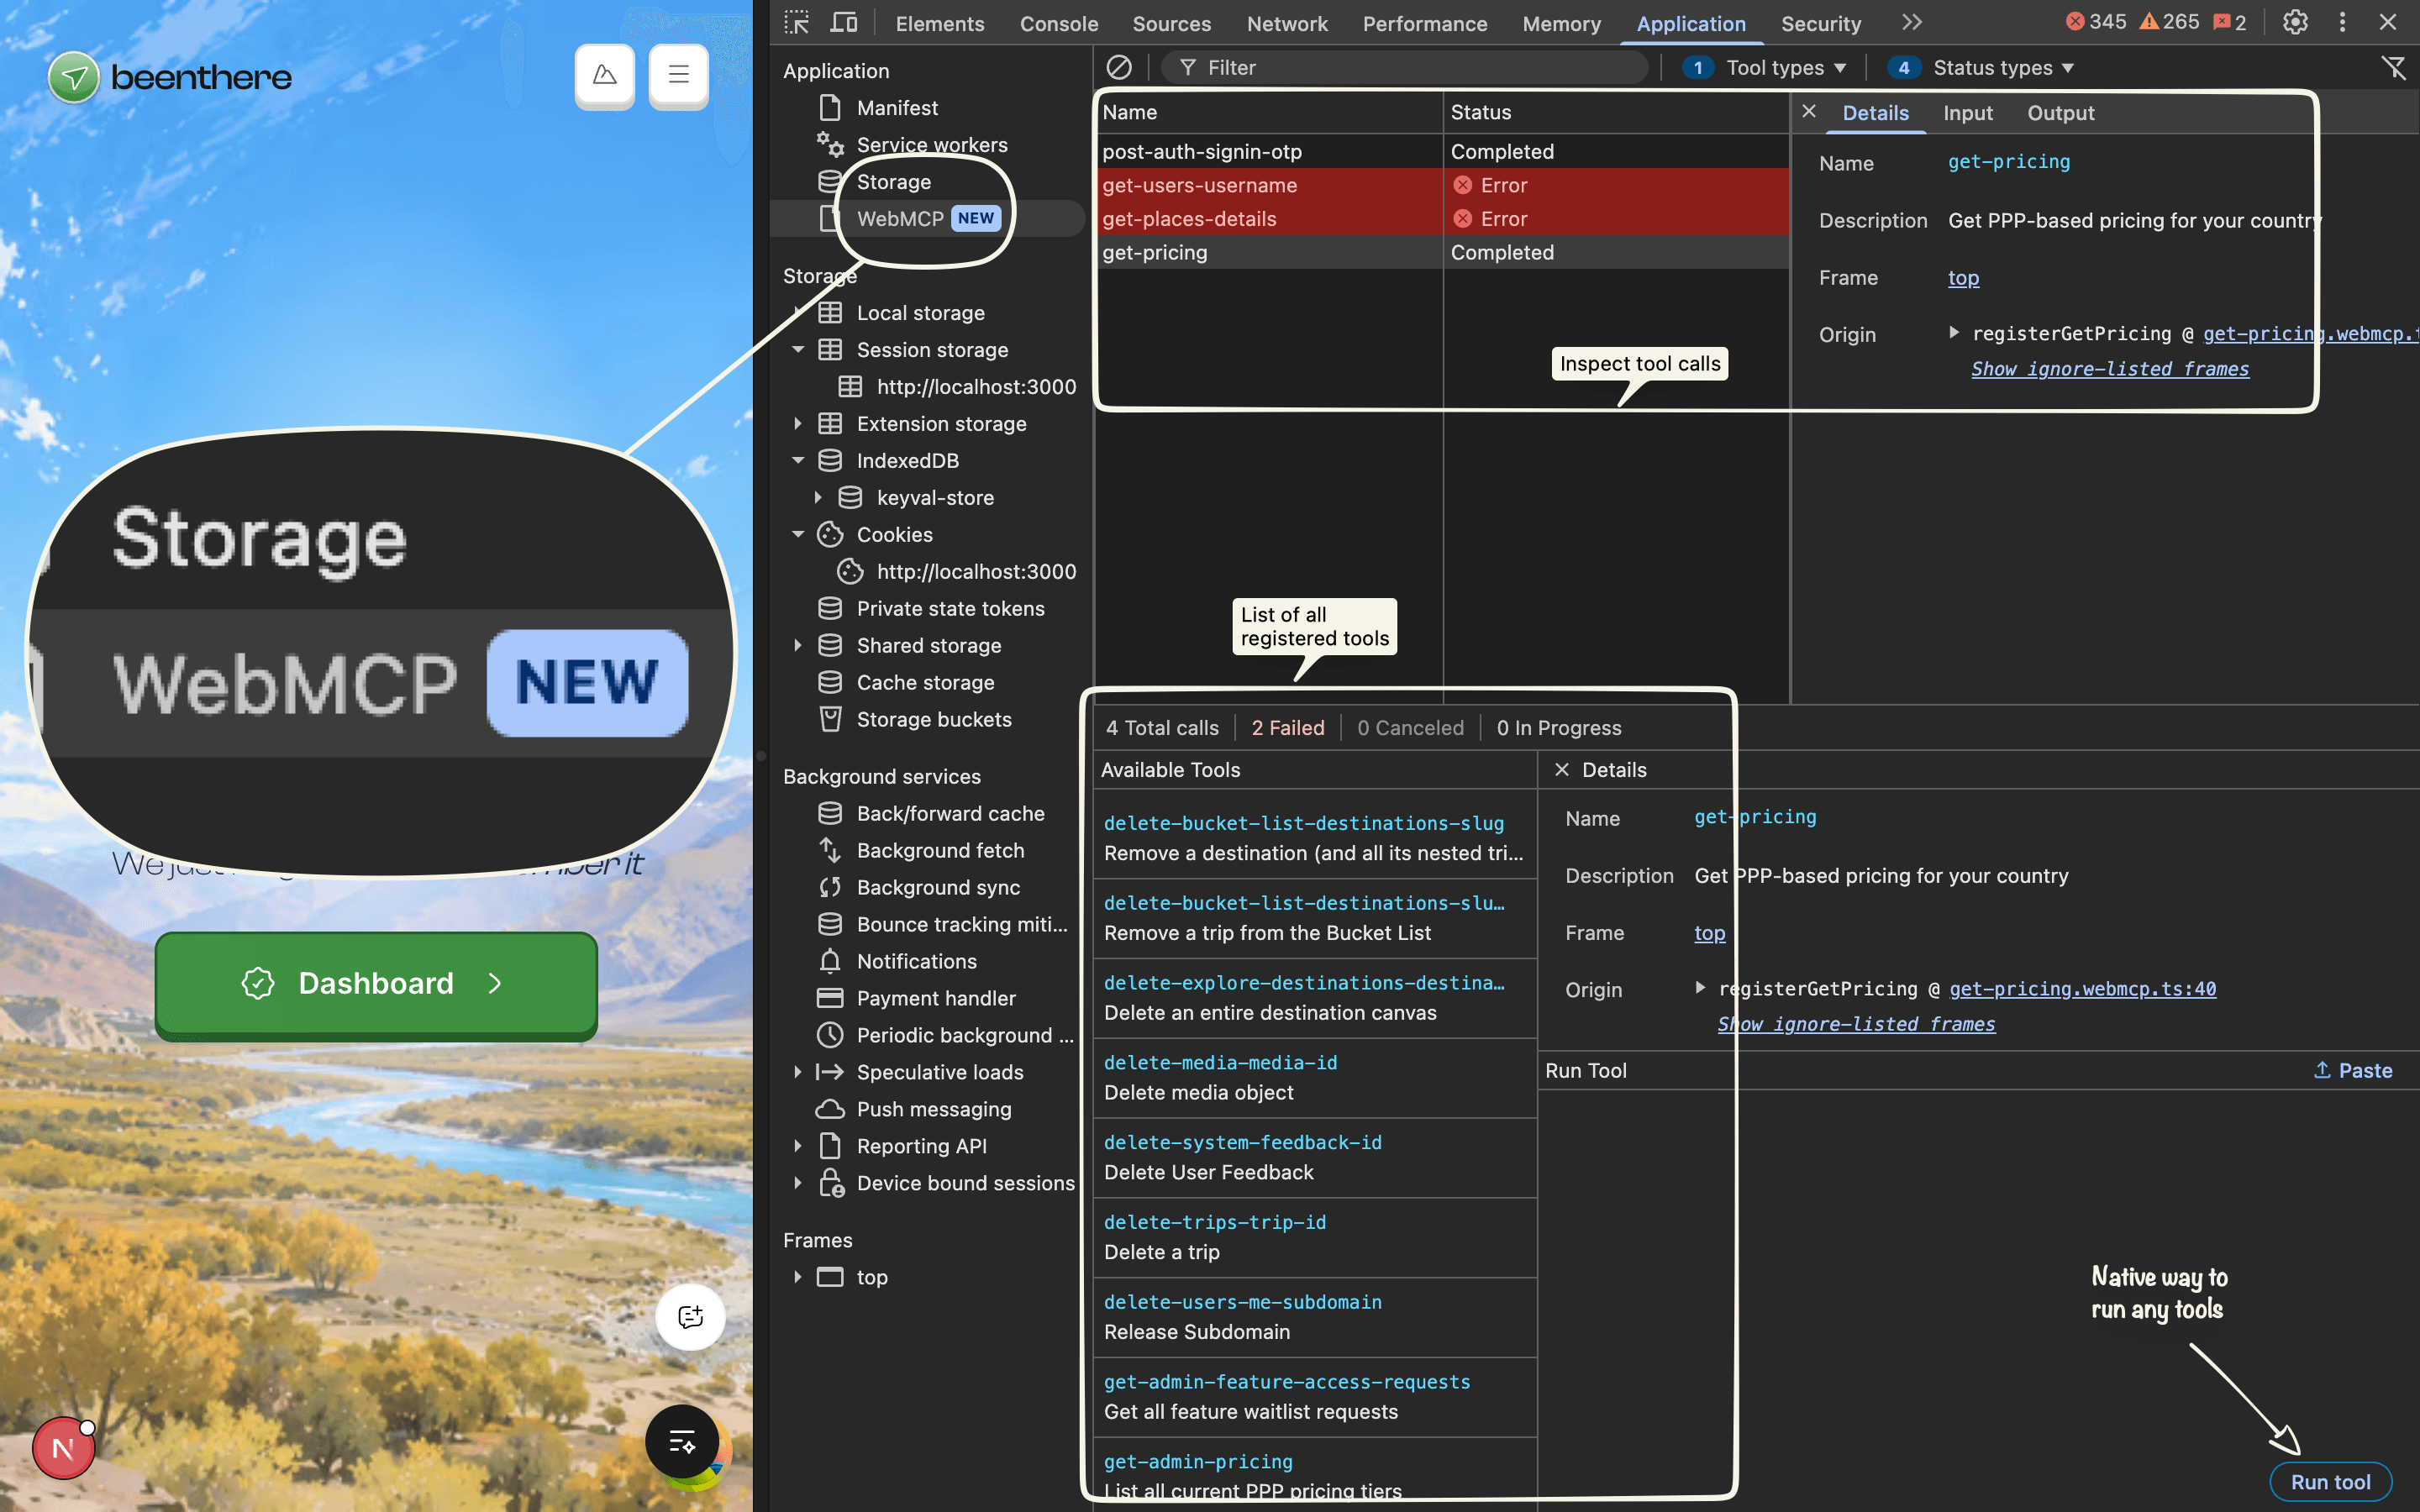
The panel has two sections:
- Available Tools — every tool currently registered on the page, with name, description, and an invocation counter
- Invoked Tools — a log of every tool call, with status, input, and output
Test a tool manually
Click any tool in Available Tools to open the test area. Enter parameters, click Run tool, and see the exact input the agent would send and the output your tool returns. This bypasses the agent entirely, so you can verify your tool's logic without writing a prompt.
What to check
- Schema validation: If your tool's return value doesn't match its declared schema, the output pane shows the error. Fix your
execute()or the schema. - Agent discovery: The invocation counter shows whether an agent ever considered your tool. If it stays at zero, your description may not match what the agent is looking for.
- Status types: Filter the Invoked Tools log by Completed, Error, or Cancelled to find failures fast.
The Inspector extension
For multi-page flows, install the Model Context Tool Inspector extension. It persists across navigation and can export tool definitions as JSON.
Use the DevTools panel for single-page validation, the extension for cross-page agent flows.